
Generating Reports
Track your event's performance with detailed exports and visual dashboards.
Overview
Bookerrrr offers two powerful report types to track your event's performance: Excel-based (CSV download) for detailed analysis and graphic-based for quick visual insights. Choose based on your needs—detailed exports or at-a-glance stats.
Excel-Based Reports (CSV Download)
Ideal for in-depth analysis with custom filters.
- Navigate to the Attendee List tab in your event dashboard.
- Click the Download CSV button.
- Open the file in Excel or similar tools for:
- Full attendee list (names, emails, registration details).
- Payment info (if applicable, including Stripe totals).
- Responses to custom questions.
- Apply Excel filters for specific insights, like attendee segments or payment summaries.
Pro Tip
The CSV auto-calculates total Stripe payments for easy revenue tracking.
Graphic-Based Reports
Perfect for instant visuals without downloads.
Access these visuals directly from your event's Reports tab to see breakdowns by ticket variants/types, such as the number of tickets sold per type and sales trends over time.
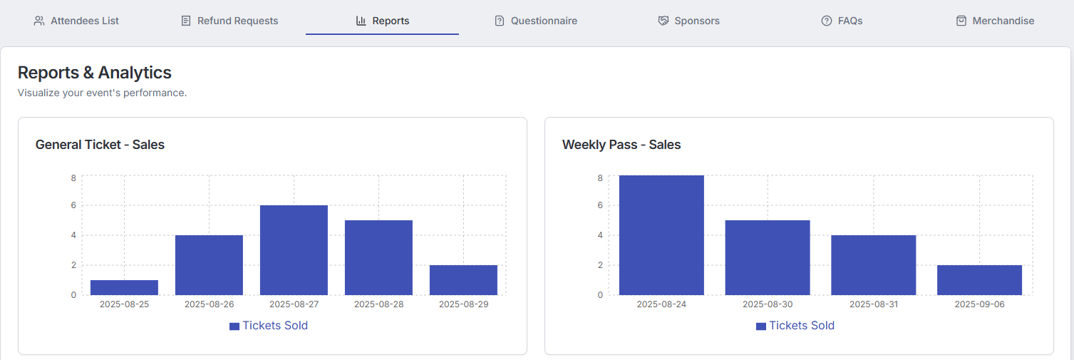
Great for quick checks—no need to download CSVs or apply filters repeatedly.
Comparison Table
| Feature | Excel (CSV) | Graphic-Based |
|---|---|---|
| Best For | Detailed exports & custom analysis | Quick overviews & trends |
| Data Included | Attendees, payments, custom answers, totals | Ticket type breakdowns |
| Access | Attendee List > Download CSV | Dashboard visuals (Reports Tab) |
| Tools Needed | Excel/Google Sheets | None—browser-based |
Frequently Asked Questions
For custom report requests or any issues, please email us at sales@bookerrrr.com.